
Last time we wrote about this, we cut around 15% off our cloud bill by finding things we were not using like Idle instances, an ElastiCache cluster we weren’t using anymore, and old S3 data.
This time we started looking into this differently, the goal was the find the largest line item from the cost explorer and start asking ourself, is this expected or something feels wrong here and start digging into each one step by step.
At the end of this exercise, we saved about $2,410 a month, roughly $28,900 a year.
So lets begin going deeper into how we achieved it.

First, a confession about how we did this
We leveraged LLMs quite heavily during the initial pass to start going into each line item from cost explorer and start collecting stats, this saved us a lot of time instead of manually going into the console and pulling data (or even do it via CLI ourself).
The setup was simple, we created read only AWS credentials, and an LLM that could query Cost Explorer, CloudWatch and the service APIs itself through aws-cli. Once we got all the data, we stopped asking it to guess and started pointing it at questions that had actual answers.
Something like “which log groups are growing fastest, and what's writing to them” or “What is increasing the RDS cost linearly every day“
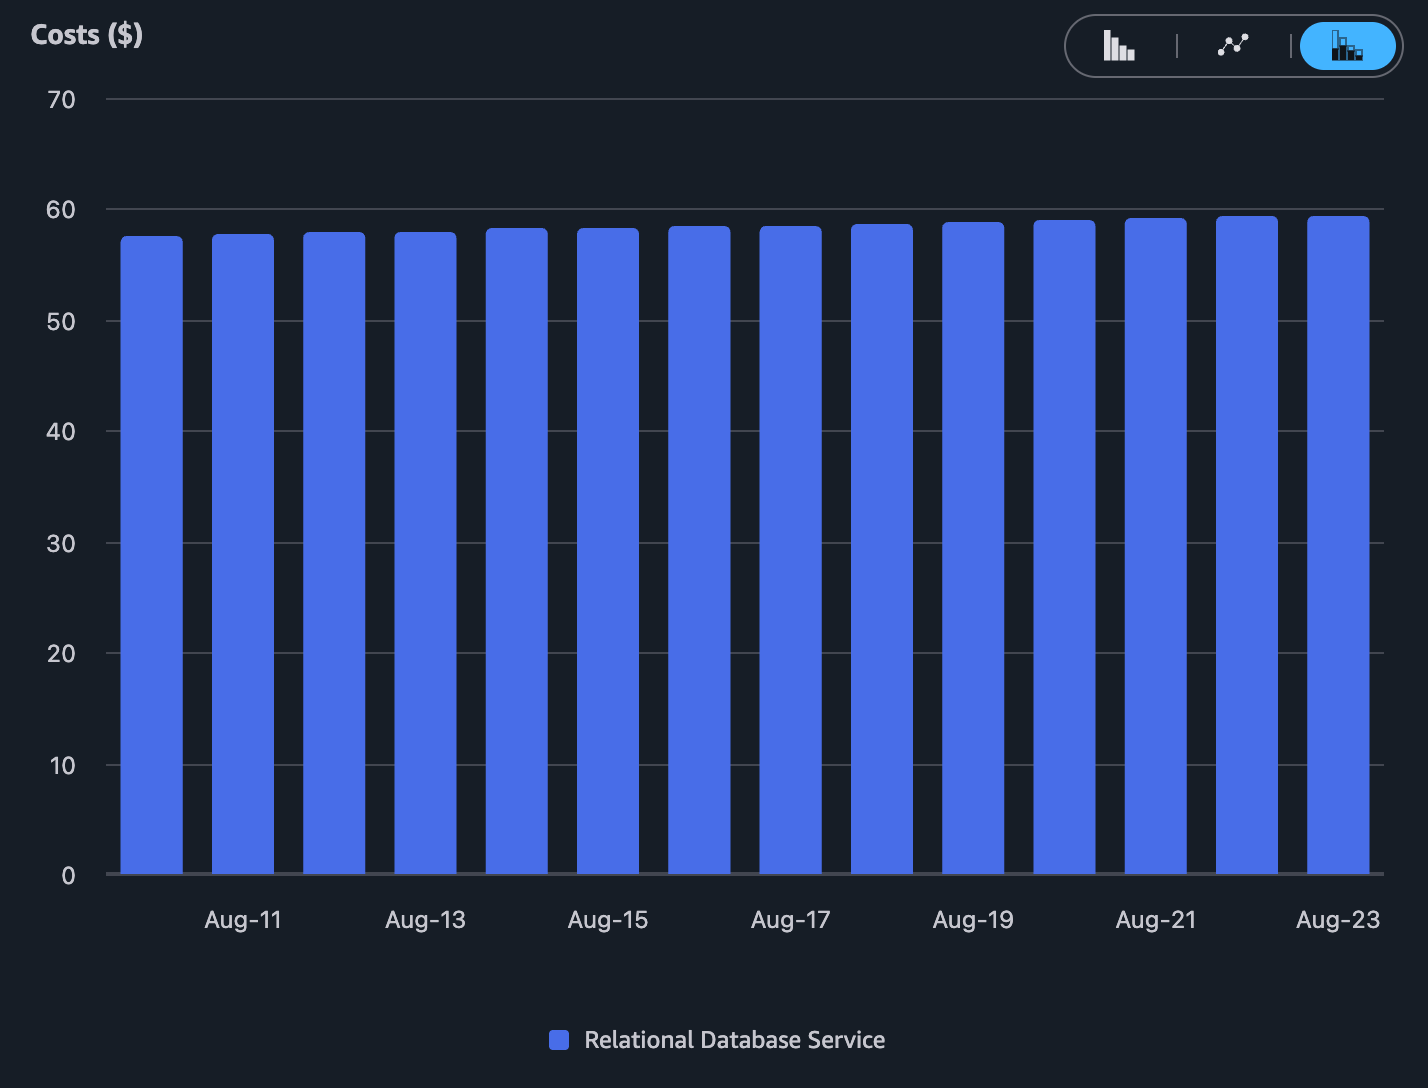
Its not easily visible but we could see that something has been increasing the RDS cost by a small percentage but its happening every single day, thats our cue to now start looking deeper into it to find whats causing it.
A few findings in this post only exist because we could ask a slightly weird question and get a real number back and that helped us a lot to focus on what was important than others.

Our backups were very, very safe
We spent a chunk of last year getting our backup story in shape for SOC 2, which meant daily snapshots on a long retention, which was all properly documented and it passed with our previous provider.
Coming back to it during a cost review, we finally asked what that policy actually cost us and it turns out that the backup storage had become most of our RDS spend.
Not the databases, but the backups of them, and it was ALOT!
Backup cost scales with how many copies you keep and how long you keep them, not with how much data you have. We were sitting on 15.7TB of snapshots for databases that come nowhere near that. Our retention was long and completely flat, so every daily snapshot just sat there for the full period and the total kept climbing.

So we went back and read the requirement again. SOC 2 just asks you to define a retention period that fits your business and then actually follow it. That's a lot more room than we'd been giving ourselves.
Now we keep daily snapshots for a month, weekly ones for a few months, and monthly ones for a year, and a handful beyond that.
We can still restore to any recent day. What went away was keeping every single daily copy for years, which was never the part doing the work. This took our backup storage from 15.7TB down to 3TB, and from that we saved around $1,200 a month.
We were paying premium rates to ignore our own logs
Our WAF and CDN logs were costing us around $640 a month.

What was happening is we were shipping them to the most expensive destination AWS sells, which charges a lot more per GB than S3, and we weren't even reading them there that often anyway.
On top of that we were logging everything, including all the normal allowed traffic, when the events actually worth keeping were the blocked ones.
So we moved them somewhere cheaper and filtered down to what we actually review. That brought it down under $70 a month. So about $600 saved, for what was honestly just a settings review that we had to do.
One line of logging
Smallest saving here, but my favorite bug of the four.
So we noticed a line item kept growing up over few months. It was $26 first, then $36, then $41, and it kept increasing in smaller increments. It was small enough nobody cared, but growing fast enough that we should’ve looked at it earlier.
It turned out to be a single line in the shared entry point every Lambda runs through, and it was logging the whole incoming event on every invocation. Now a single line feels small but some of our workflows invoke these lambda’s a lot more than others and the concentration of it on some major lambda was clearly visible as a line item in cost.
One log line is almost free. The same line a few million times a month is a cost that should be accounted for.
So we replaced it with a summary line that drops the payloads. It was 99% smaller than the previous dump of whole event.

Another lambda producing most of our volume had a completely different problem we'd never checked. It was logging inside a processing loop, one line per item, across hundreds of thousands of items. The fix was simple, DON'T LOG IT! We only cared about error scenario, there was no point in storing all those info logs.
We were paying tolls to talk to ourselves
This one started as a cost question and turned us into a better architecture, which is my favorite kind of exploration we did.
So our edge handles around 155 million requests a month. When we looked at the traffic split, most of it wasn't users. It was just us. Our frontend app in Next.js renders pages server side, which means it calls our own API to fetch data. Those calls were leaving our network, crossing the public internet, and coming back in through our own CDN and WAF to reach a backend sitting in the same AWS account.
That's a very common setup and it works fine. It also means paying public edge rates for traffic that never needed to go outside.

The part that made it harder than it sounds
We can't just point the frontend at the backend's internal address.
There are 2 main reasons:
First, networking. Our frontend and backend live in separate networks, both using the same internal address range. You can't join two networks that use identical addressing, because the addresses stop being unique.
Second, caching, and this was the bigger problem. In our current setup, the CDN was absorbing about three quarters of those internal calls. If we pull the CDN out of the path and all of that lands on the backend at once, it would not work well, we would need to scale up our systems for data which could easily be cacheable.
So before touching any networking, we put a small cache next to the frontend holding exactly what the CDN had been holding. Then we turned it on while the CDN was still in front, so if it underperformed we'd find out harmlessly.
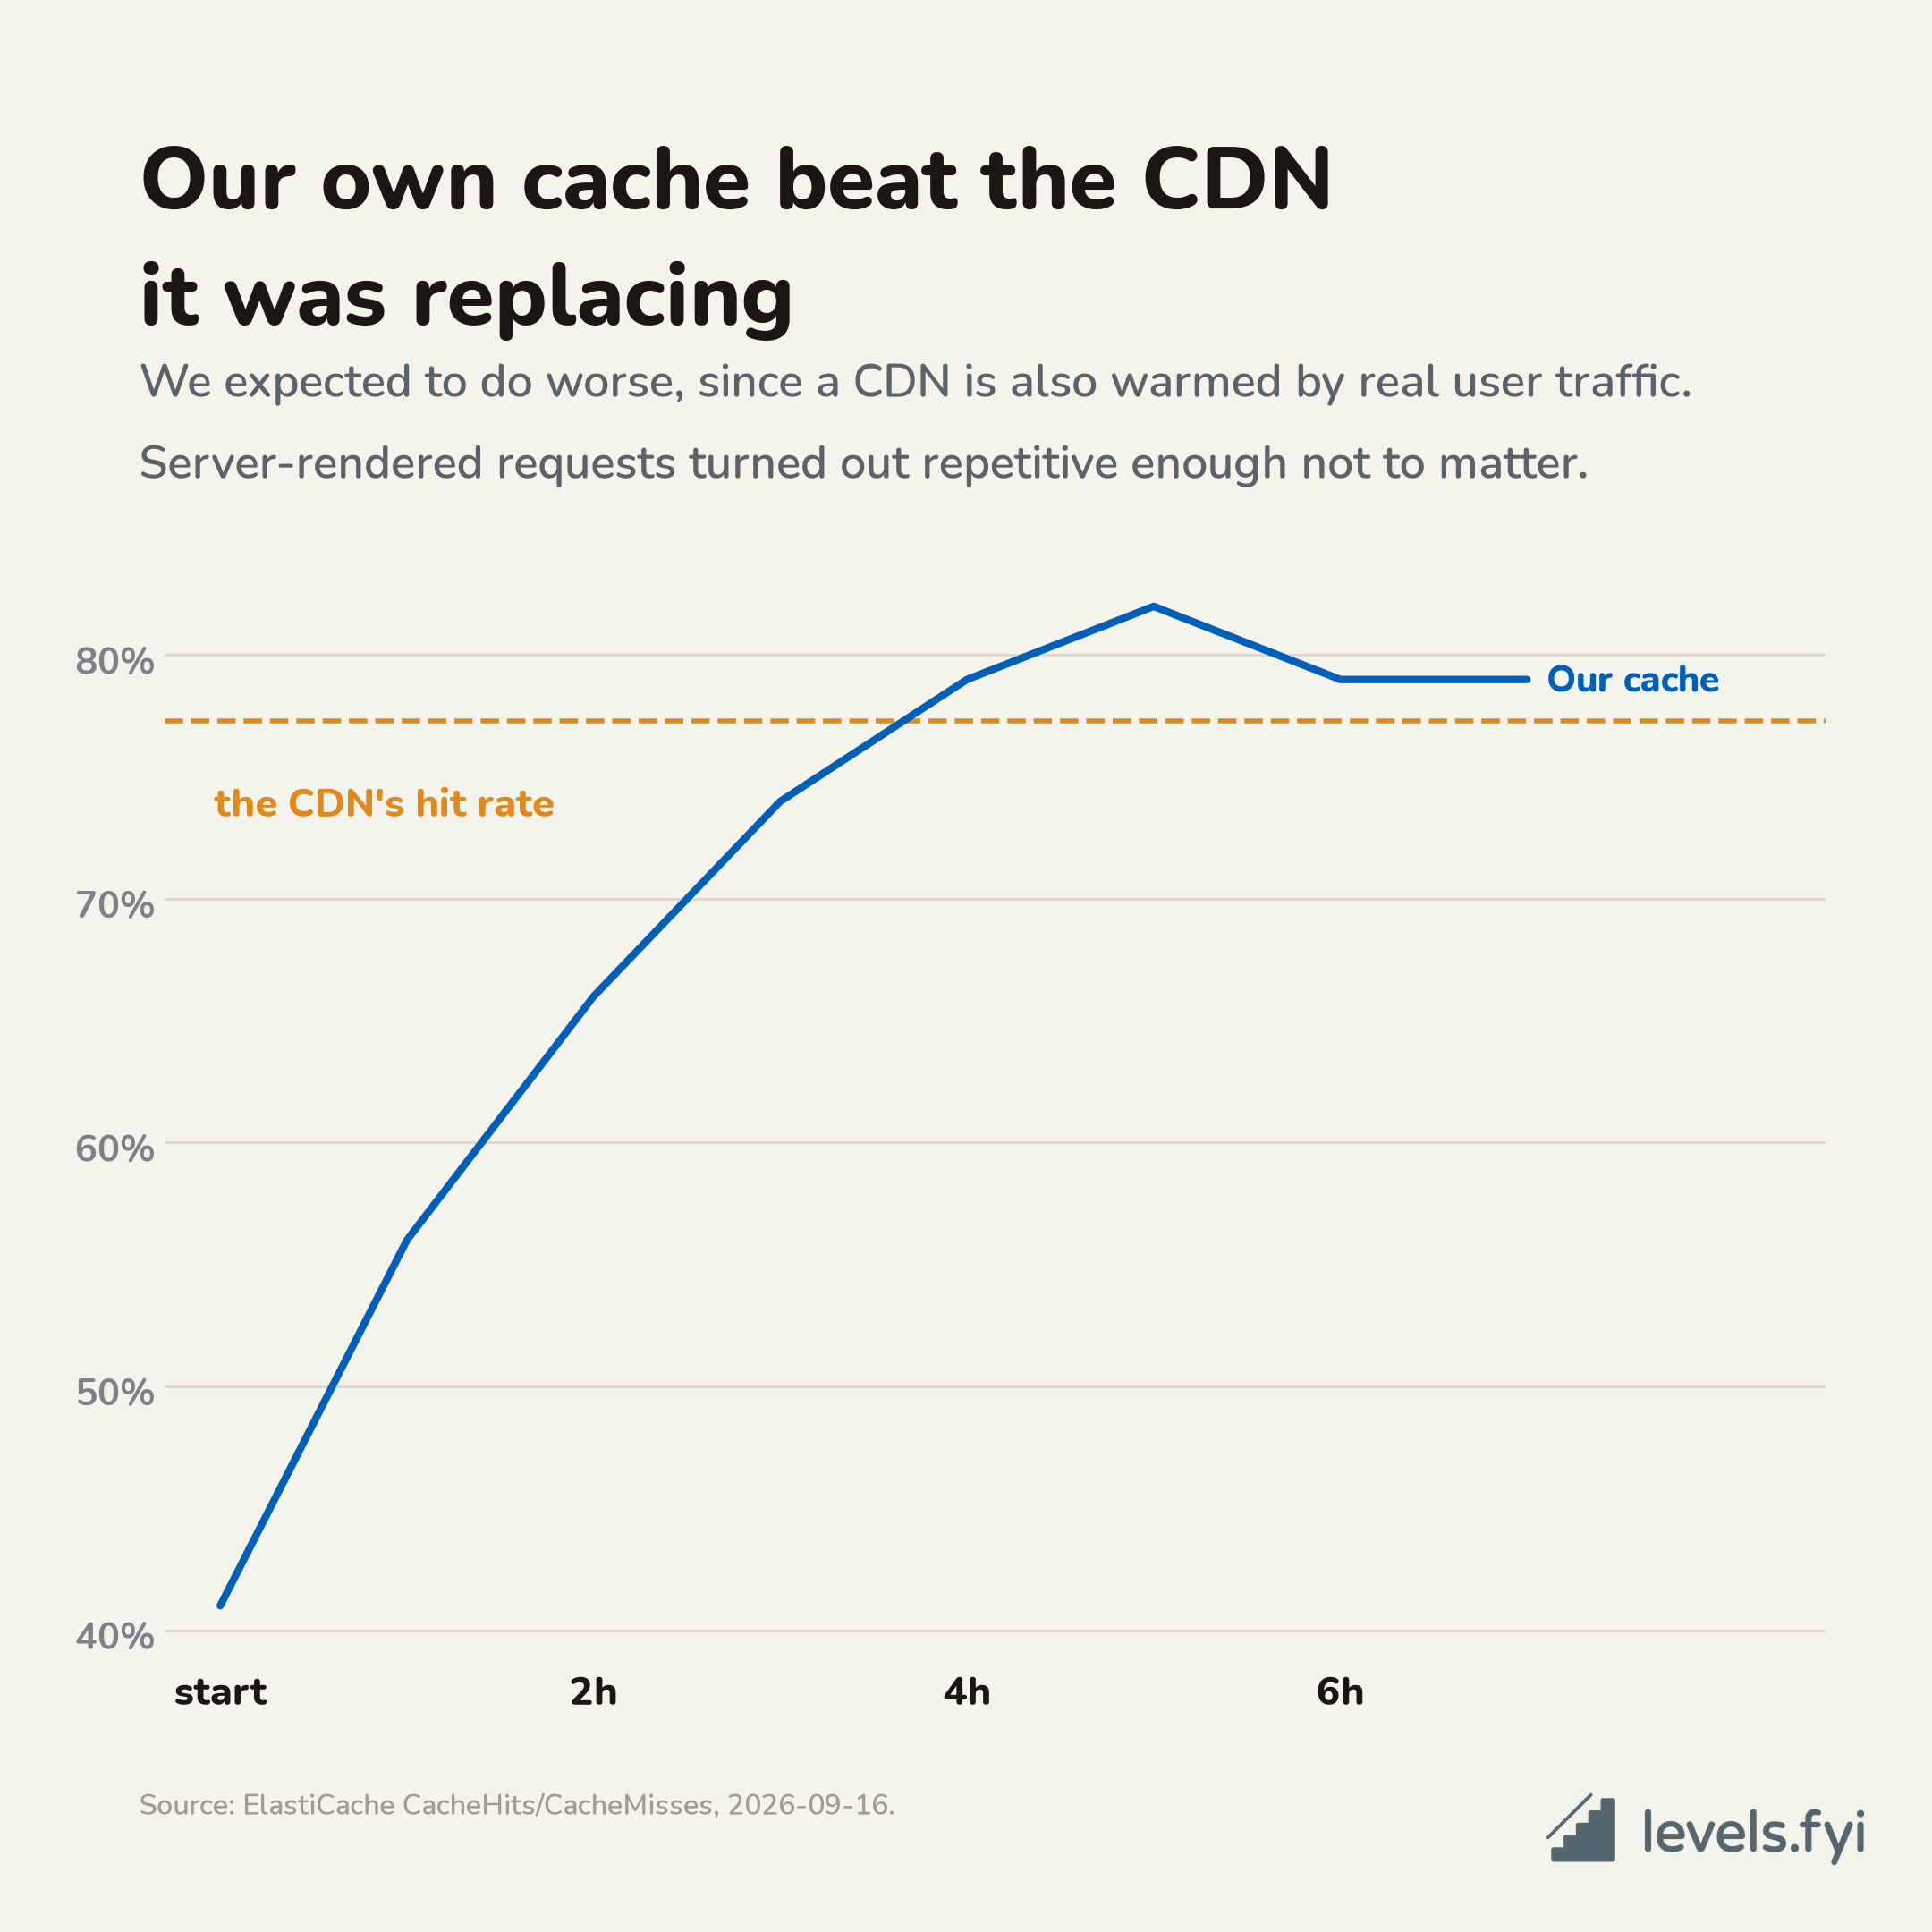
It settled at 78.8%, against the 77.3% the CDN had been managing. We'd assumed we'd do worse, because a CDN gets warmed by real user traffic that a server side cache never sees. Turns out server rendered requests are repetitive enough that it didn't matter.
Once this was done, we did the network switch from routing backend calls from public internet to private net and we used AWS PrivateLink for that.
What we got
Internal traffic through our public edge dropped by more than 99%. Around half a billion requests a month that used to cross our CDN and firewall now never leave our own network.
That's about $549 saved a month once the new pieces we added are paid for, and the new pieces are cheap. The whole private networking setup is $36 a month. The cache node was a Valkey cache we added specifically just for this.
With this the whole edge got quieter too. CloudFront requests down about 73%, WAF requests down about 72%, and the NAT gateway our frontend uses to reach the internet dropped about three quarters of its traffic.
Now there are parts we didn't plan for first but we got it as side effect of doing this. The internal hop is roughly three times faster, because a call that used to go out to the internet and back now takes a direct path, now the same requests which were 18ms became 6ms.
One side effect we didn't expect: for a while our backend was handling more traffic than before, not less. We had capped how long the new cache holds certain responses to keep its memory in check, and the CDN had been holding those same ones for hours. Loosening that cap brought it back to where it started. We only spotted it because we were watching both sides of the swap, not just the side we were trying to improve.
Apart from all this, the security side is what I actually care about in long term. Our public edge protections now only have to reason about genuinely public traffic. When two thirds of what you're inspecting is your own infrastructure, every rule you write has to be careful not to break you, and anything priced per request costs you three times what it should. Taking the internal traffic out of that path makes a few things practical that were previously too expensive to bother with.
Things that cost us time
Cost Explorer's most recent day is incomplete, so don’t trust the last few days data. We checked the day after a change and saw WAF costs down 37% and CloudFront down 17%. Very encouraging. Then we looked at RDS, a line item nothing had touched, and it was down 54% on the same day. The day just wasn't fully billed yet.
So now we always check something that shouldn't have moved. If it moved, the data isn't ready yet. So its best to wait out a few days before cross checking stats from Cost Explorer, however if you just want to confirm what you are doing is actually working, best trust any realtime events like logs to confirm your hypothesis, which is what we did.
A timeout can measure something other than what you think. We gave our cache lookups a 50ms budget and it tripped the breaker 21 times in ten minutes, with no actual errors. The cache was answering in microseconds. What the timeout was really measuring was how long until our process got around to noticing the answer, and during server side rendering the process is busy rendering. We were timing ourselves being busy. Worse, the timeout cancelled nothing, so it threw away reads that had already succeeded and paid for the API call anyway.
A proof of concept that tests one instance is testing just that one instance. Ours worked perfectly, so we wrote "known quantity" in the tracking doc and moved on. It had tested one instance and got lucky. Half our fleet sat in a zone the new path didn't cover and would have timed out instantly. Found it before cutting over rather than after, which is the only reason this is a lesson and not an incident.
Wrapping up
About $2,410 a month across four fixes, and we didn't switch off a single thing.
The backup policy was doing its job, the logs were storing exactly what we asked it to store. Nothing here was a “bug”, it was the system doing exactly what it was supposed to do, it was just us finding out, maybe we want it to do something else.
If there's one habit worth stealing from this: open Cost Explorer, find your biggest line item, and start asking yourself, is this expected or something is buggy!
Written by Akash Rajpurohit.